Choose 4K for the pixel detail you actually need
Compare two real 27-inch native pixel grids, connection requirements and the difference between detail and usable workspace.
Updated:
4K adds native pixels, not a larger enclosure
Choose a 4K monitor when the extra native detail serves your work and your computer supports the intended display mode. Do not expect the label alone to make text comfortable, improve every source image or increase the desk area available for a display. Compare the exact pixel grid, physical size and connection route together. If your current problem is a cramped support arrangement or an undocumented USB-C port, a higher pixel count does not settle it.
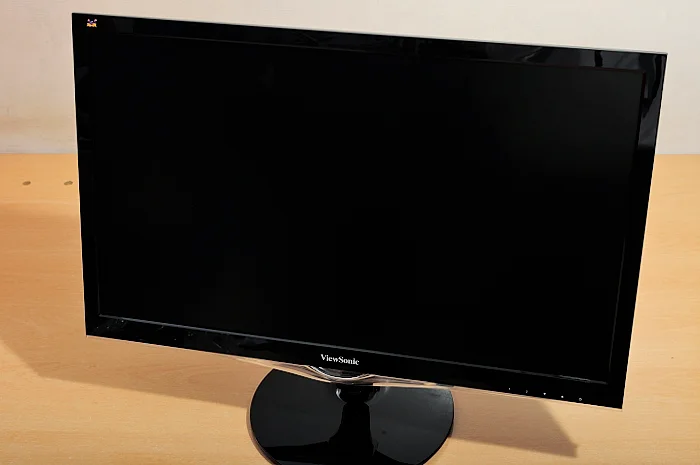
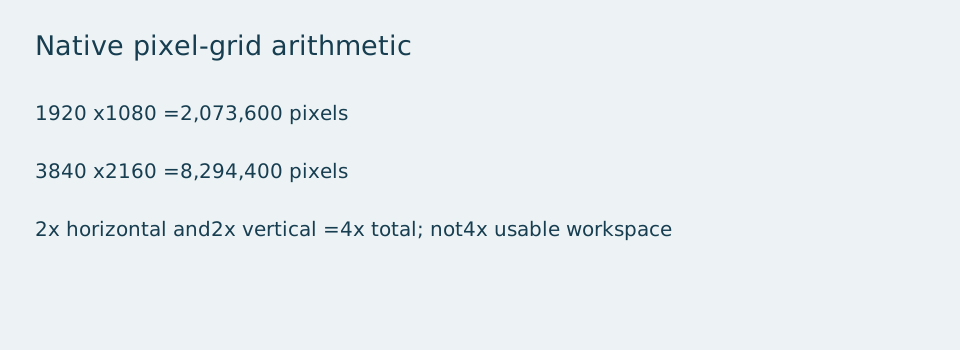
For a concrete comparison, Dell’s US P2725H documentation lists a 27-inch screen at 1920 × 1080 pixels, while P2725QE lists a 27-inch screen at 3840 × 2160 pixels. The P2725QE has twice as many pixels in each direction. Multiplication gives four times the total pixel count, rather than twice. These are manufacturer specifications checked on 2026-10-28, without a current-price or stock claim.
Two exact models show the difference
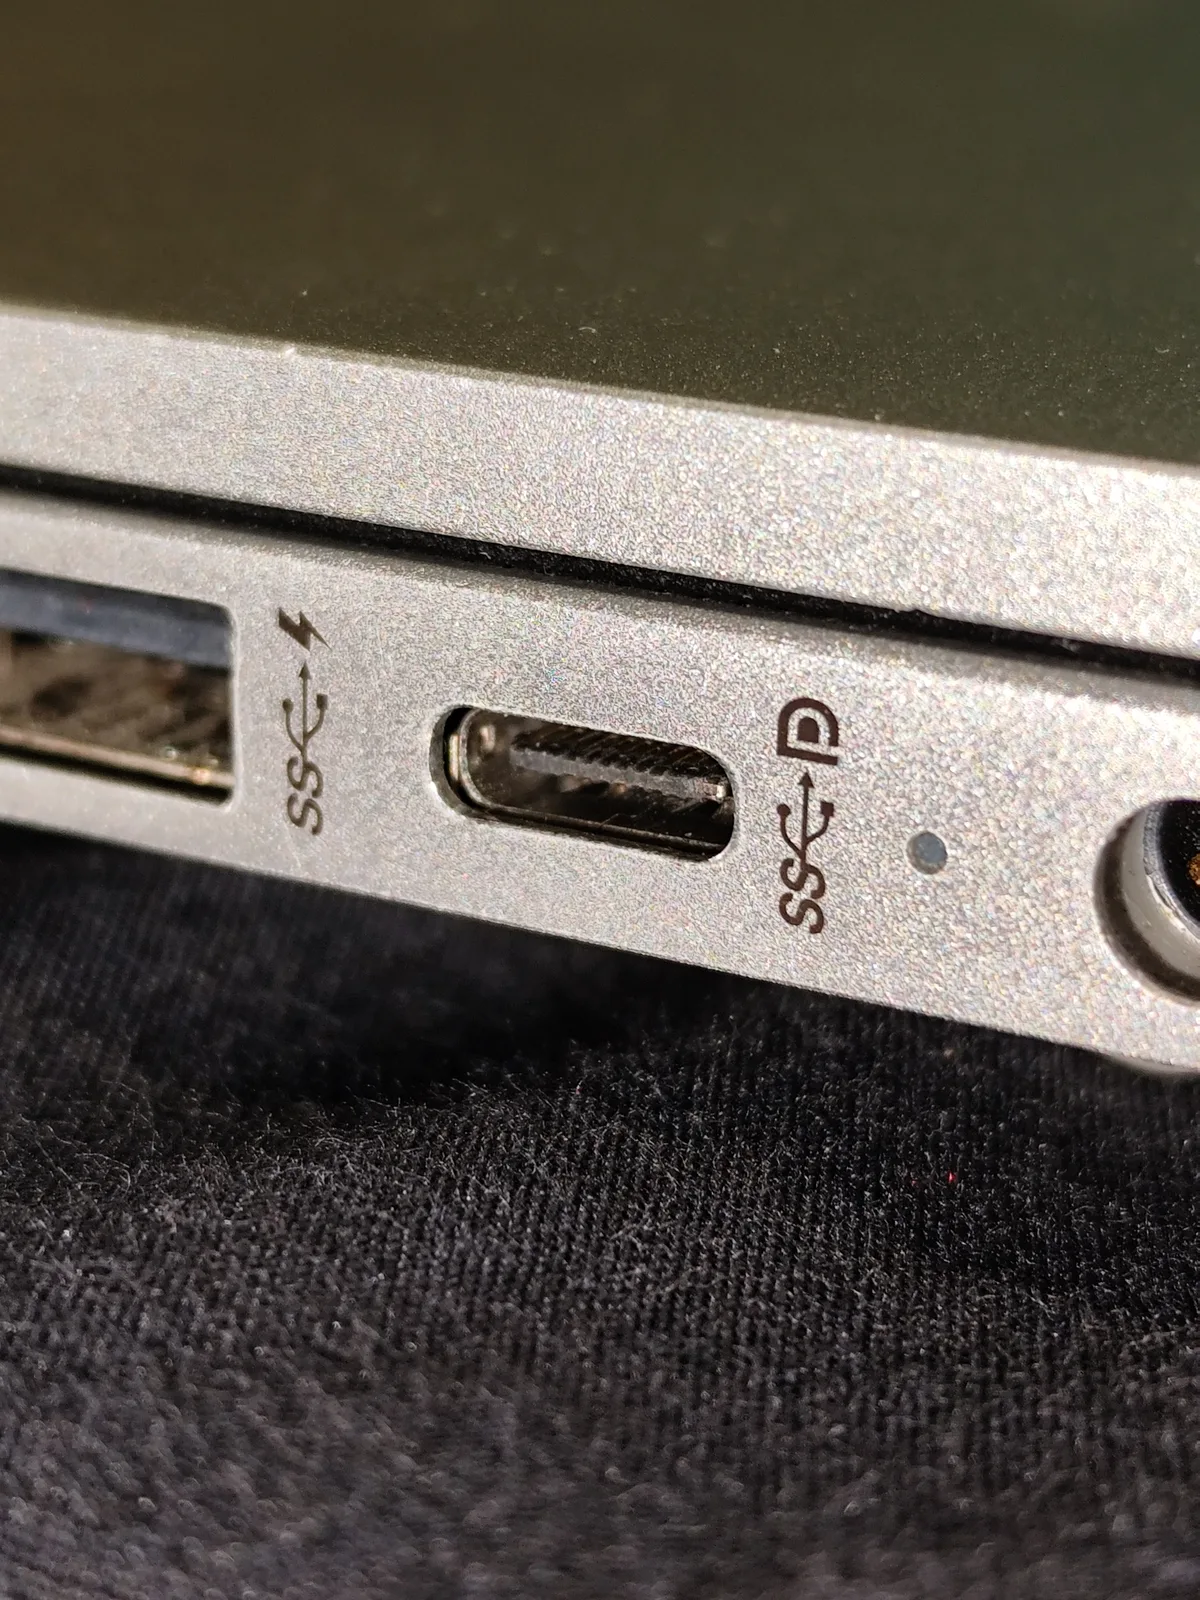
The same nominal diagonal makes these pixel grids useful to compare, but the models are not otherwise identical. P2725QE documents a USB-C upstream video path using DisplayPort Alt Mode; P2725H’s USB-C connector is downstream and data only. If a one-cable USB-C video arrangement is a requirement, that distinction can eliminate a superficially similar option before pixel detail becomes the deciding factor. It still leaves your source capability and cable requirements to verify.
| Exact model | Native pixels at nominal27in | Relevant USB-C distinction |
|---|---|---|
| Dell P2725H | 1920 ×1080; 2,073,600 total | Downstream data-only socket |
| Dell P2725QE | 3840 ×2160; 8,294,400 total | Upstream DP1.4 Alt Mode video path |
Scaling changes the practical workspace
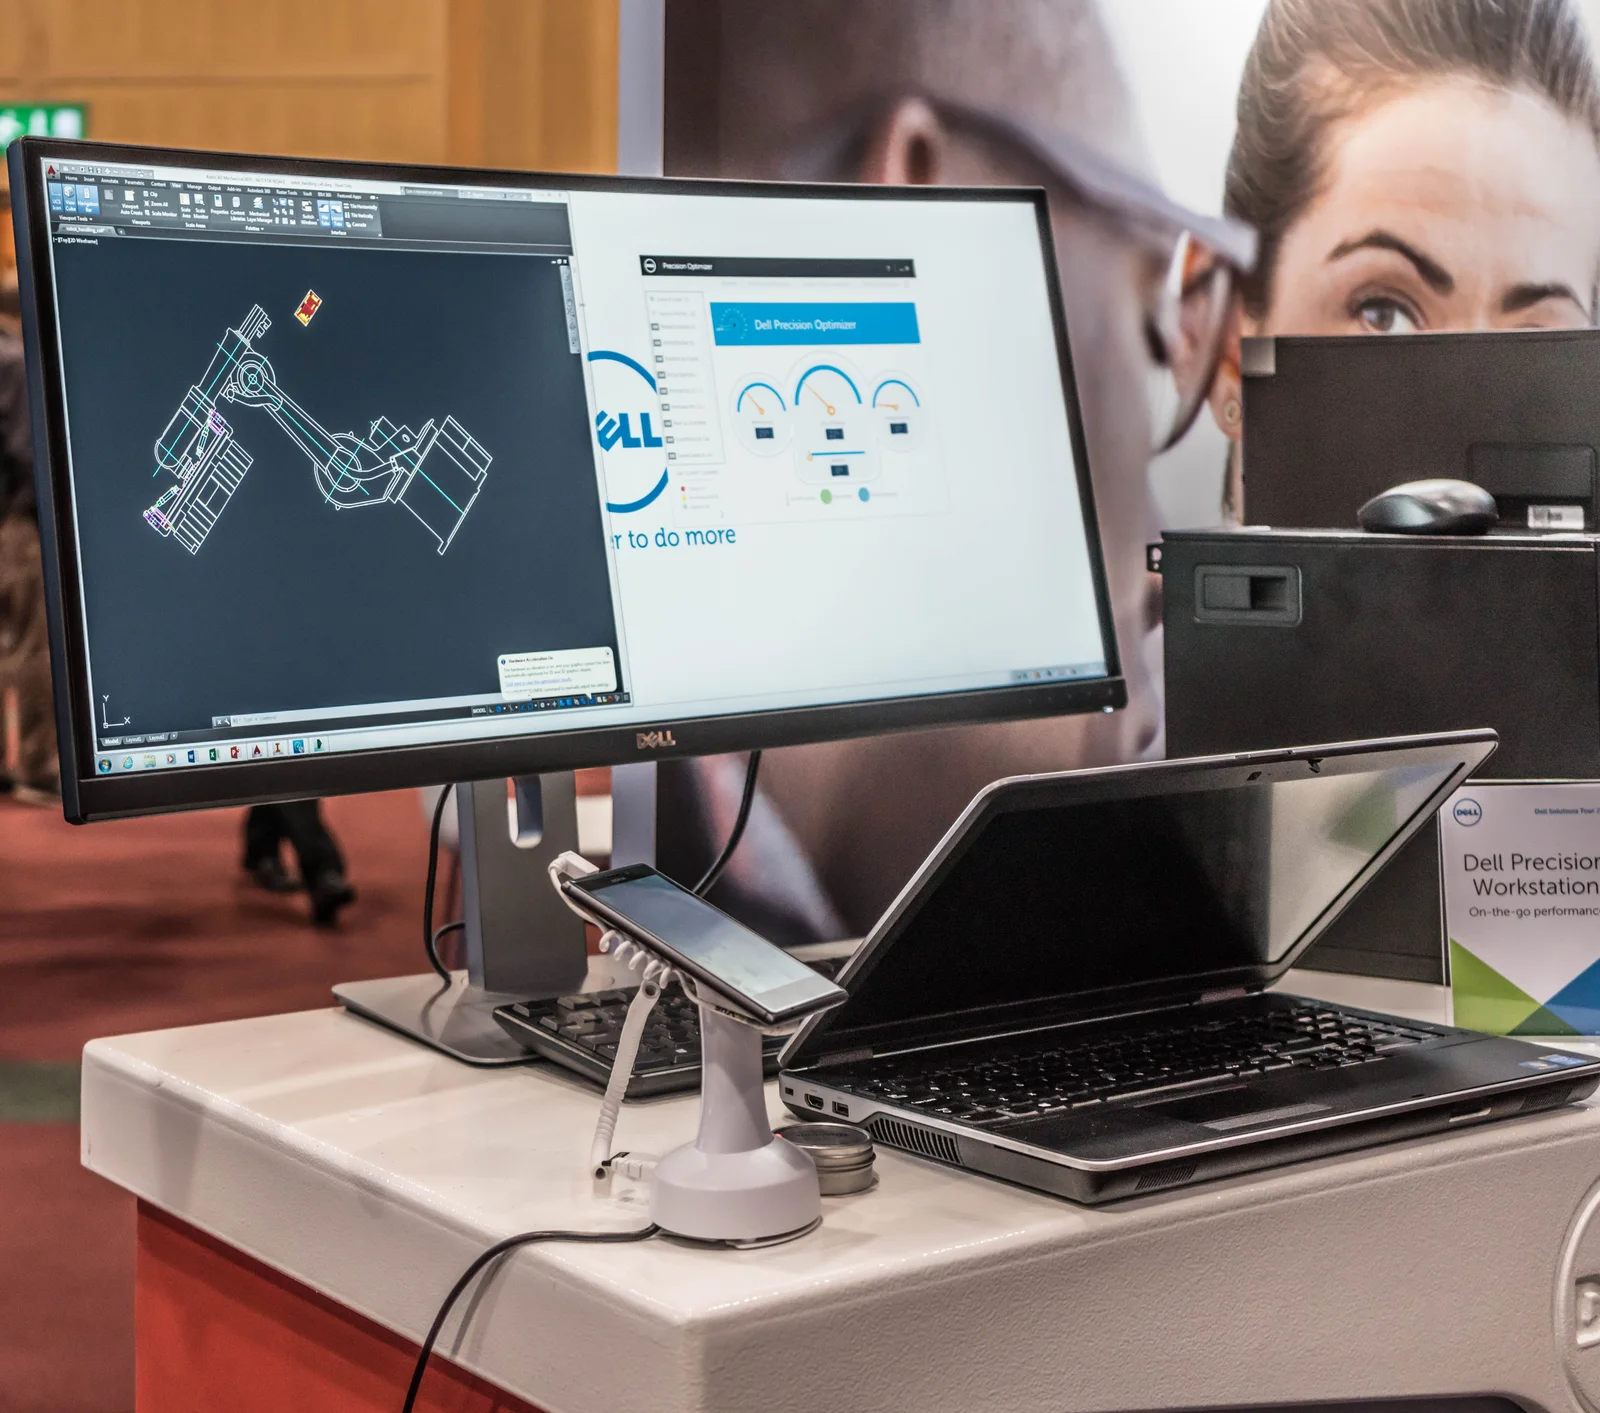
The number of physical pixels does not equal the number of comfortably readable application units. A higher-resolution display may be used with operating-system scaling that enlarges text and controls. The resulting arrangement can improve detail while keeping interface elements at a useful size, instead of simply fitting four copies of your old desktop. Application behavior, source content and personal needs matter; a raw pixel ratio is not a productivity prediction.
Use a familiar document or application to decide what you want to see clearly. Record the current resolution and scaling settings, then distinguish a need for sharper source detail from a need for larger interface elements or a different layout. Avoid reducing resolution merely to make a screenshot resemble another monitor: doing so changes what is being compared. The density calculator describes pixels per inch, not an eyesight assessment or a guaranteed scaling recommendation.
Check the intended mode through the complete connection
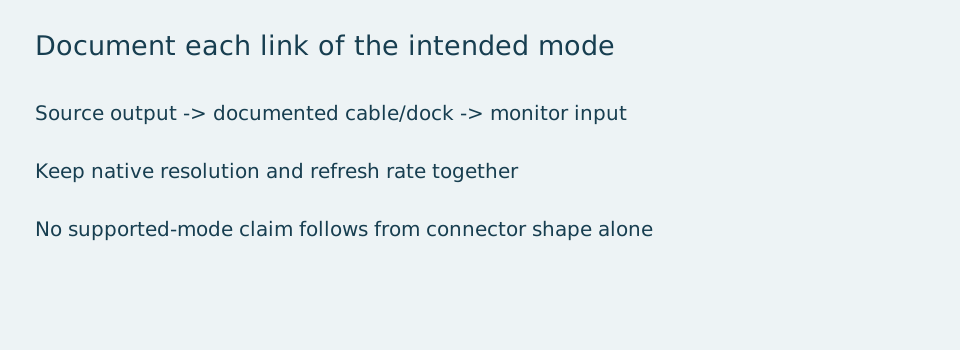
Write the intended resolution and refresh rate together and trace the source, cable, any dock and monitor input. A supported pixel count on one component does not establish the complete route. Use the exact model’s documented modes and any relevant restrictions, rather than assuming that a connector version or an expensive cable guarantees the result. If the documentation leaves a gap, settle that specific gap before buying.
The archival photographs illustrate different real monitor forms and a physical connection endpoint. They are not photographs of the two exact models in the comparison table, and they are not evidence of a particular native pixel count. A photographed screen image cannot reliably establish sharpness or color quality for your use. Keep the documented comparison separate from what those photographs can actually show.
Make the decision about the full requirement
Prefer the configuration that meets the documented source path, physical arrangement and needed image detail, with unresolved conditions made explicit. If both pixel grids would serve the intended application, there is no measured value judgment here that automatically selects the higher one. This guide gives the real differences needed to narrow the choice; it does not establish current bargains, hands-on image quality or a universal best monitor.